How to use the shapes object tikzpy.shp
Examples of how to use the shape objects tikzpy.shp.
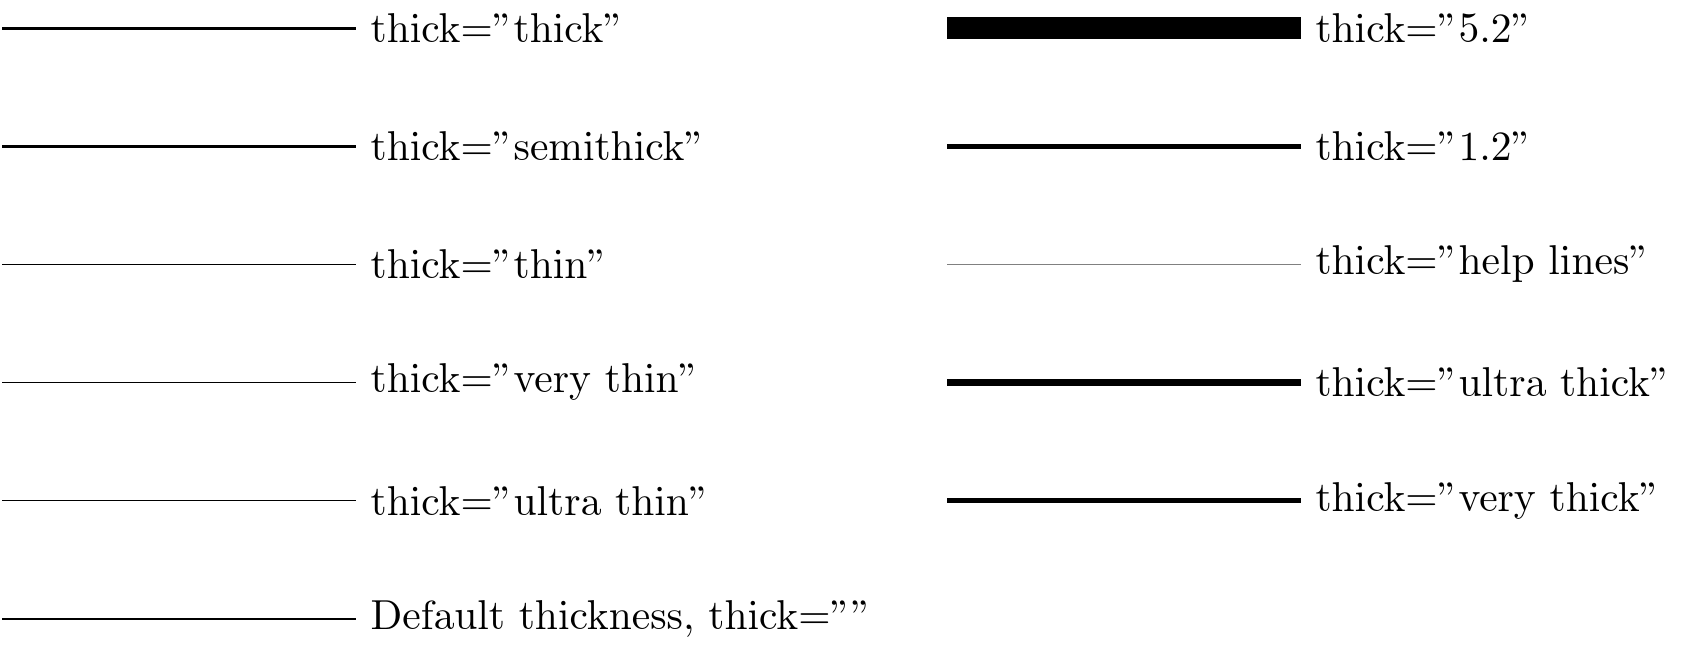
Example 1 - Thick property of shpes options
The property thick applies to the thickness of the line and path shapes, as well as the contour border of 2D shapes such as rectangles, circles, arc, grid and parabole.
Available thicknesses values for property thick:
Drawing created with the following tikzpy code:
 1# python3
 2
 3### Load tikzpy library
 4import os, sys
 5import tikzpy as py_tikZ
 6
 7### Load main object
 8tikZ = py_tikZ.load()
 9tikZ.dpi=300
10
11### Add point at x=0, y=0, z=0
12p1 = tikZ.pto.pto(0,0,0, layer=0, alias='pto1')
13p2 = tikZ.pto.pto(3,0,0, layer=0, alias='pto2')
14
15### First line
16l = tikZ.shp.line(p1,p2,thick="") #Default case
17tx = tikZ.shp.text(p2, "Default thickness, thick=\"\"", layer = 0)
18tx.position = "right"
19
20# Types of line
21thick_types = l.line_thick_options()
22thick_types.append(1.2) ### Is possible to set the thickness number: line width=0.2cm
23thick_types.append(5.2)
24in_y = 1
25in_x = 8
26
27#Iterate types
28ii = 1
29for t in thick_types:
30    p1 = p1.copy()
31    p2 = p2.copy()
32    p1.y = p1.y + in_y
33    p2.y = p2.y + in_y
34    l = tikZ.shp.line(p1,p2,thick=t)
35    tx = tikZ.shp.text(p2, "thick=\"%s\"" % str(t), layer = 0)
36    tx.position = "right"
37    ii = ii + 1
38    if ii == 6:
39        p1 = tikZ.pto.alias('pto1').copy()
40        p2 = tikZ.pto.alias('pto2').copy()
41        p1.x = p1.x + in_x
42        p2.x = p2.x + in_x
43
44### Make drawing
45path = os.path.dirname(os.path.abspath(__file__))
46name = os.path.basename(os.path.abspath(__file__))
47name = os.path.splitext(name)[0]
48tikZ.save_pdf(path, name)
49
50
Further bibliography pages 311 TkZ-PGFmanual
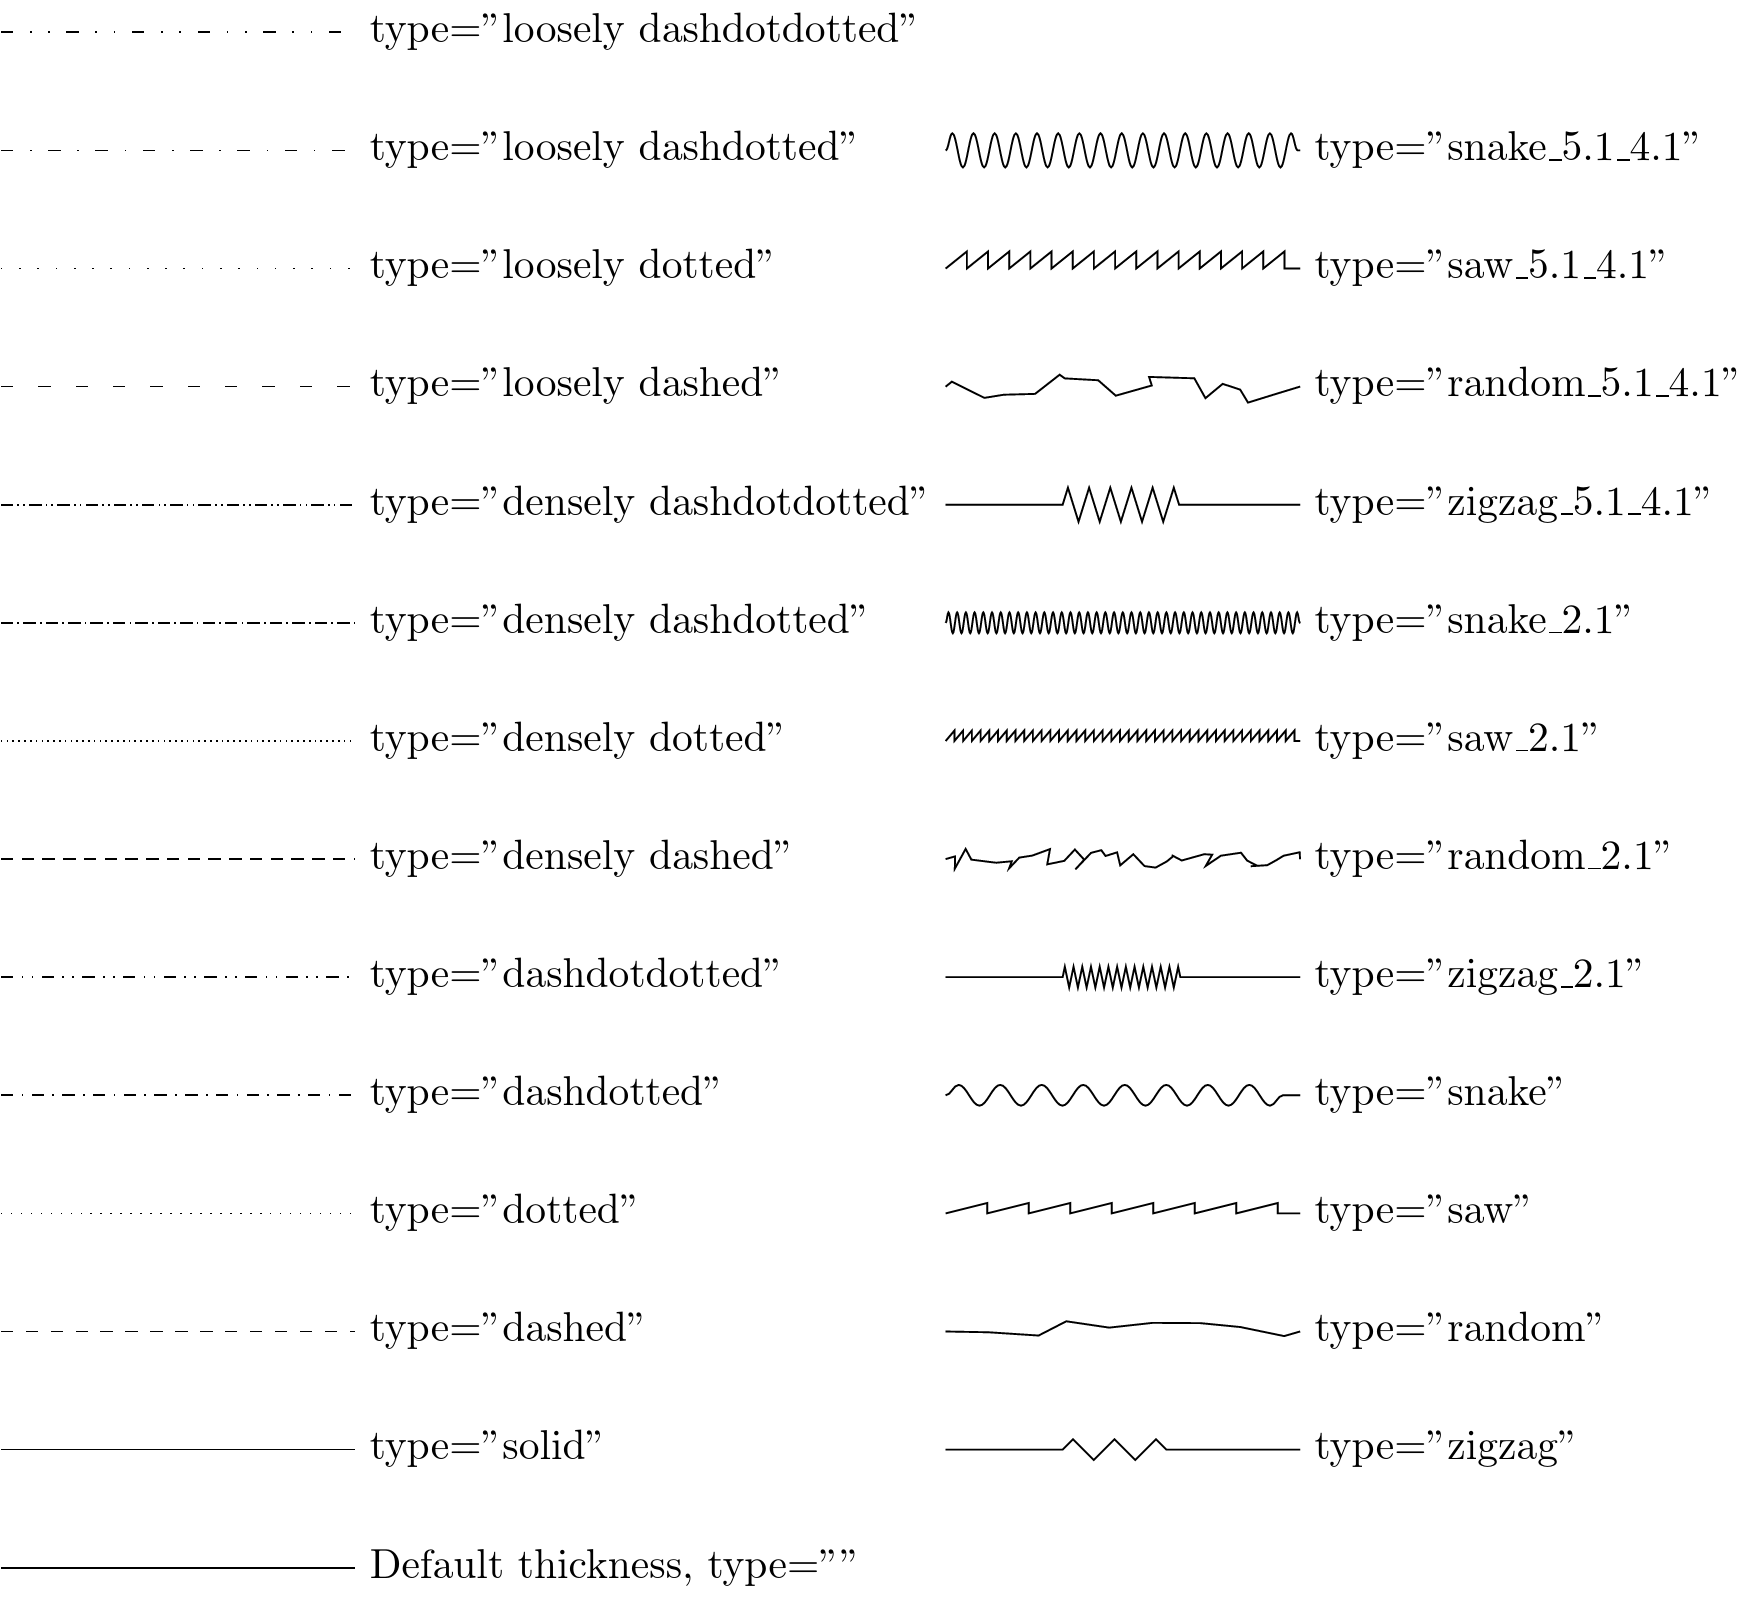
Example 2 - Type property of shpes options
Available types of line values for property type:
The property type applies to the line decoration of line and path shapes, as well as the contour border of 2D shapes such as rectangles, circles, arc, grid and parabole.
In the case of snake, zigzag, random and saw types is possible to modify the amplitude and the segment length adding the values with an underscore line. As in the following examples:
type = “line type”
type = “line type_segment length”
type = “line type_segment length_amplitude”
Drawing created with the following tikzpy code:
 1# python3
 2
 3### Load tikzpy library
 4import os, sys
 5import tikzpy as py_tikZ
 6
 7### Load main object
 8tikZ = py_tikZ.load()
 9tikZ.scale = 1.00
10tikZ.scale_text = 1.00
11tikZ.density = 100
12
13### Add point at x=0, y=0, z=0
14p1 = tikZ.pto.pto(0,0,0, layer=0, alias='pto1')
15p2 = tikZ.pto.pto(3,0,0, layer=0, alias='pto2')
16
17### First line
18l = tikZ.shp.line(p1,p2,thick="") #Default case
19tx = tikZ.shp.text(p2, "Default thickness, type=\"\"", layer = 0)
20tx.position = "right"
21
22# Types of line
23line_types1, line_types2 = l.line_type_options()
24line_types = line_types1 + line_types2
25in_y = 1
26in_x = 8
27
28# Add segment length to type line
29for l in line_types2:
30    line_types.append(l + "_2.1")
31
32# Add segment length and amplitude to type line
33for l in line_types2:
34    line_types.append(l + "_5.1_4.1")
35
36#Iterate types
37ii = 1
38for t in line_types:
39    p1 = p1.copy()
40    p2 = p2.copy()
41    p1.y = p1.y + in_y
42    p2.y = p2.y + in_y
43    print( t)
44    l = tikZ.shp.line(p1,p2,type=t)
45    tx = tikZ.shp.text(p2, "type=\"%s\"" % t.replace("_","\\_"), layer = 0)
46    tx.position = "right"
47    ii = ii + 1
48    if ii == 14:
49        p1 = tikZ.pto.alias('pto1').copy()
50        p2 = tikZ.pto.alias('pto2').copy()
51        p1.x = p1.x + in_x
52        p2.x = p2.x + in_x
53
54### Make drawing
55path = os.path.dirname(os.path.abspath(__file__))
56name = os.path.basename(os.path.abspath(__file__))
57name = os.path.splitext(name)[0]
58tikZ.save_pdf(path, name)
Further bibliography pages 159,377 TkZ-PGFmanual
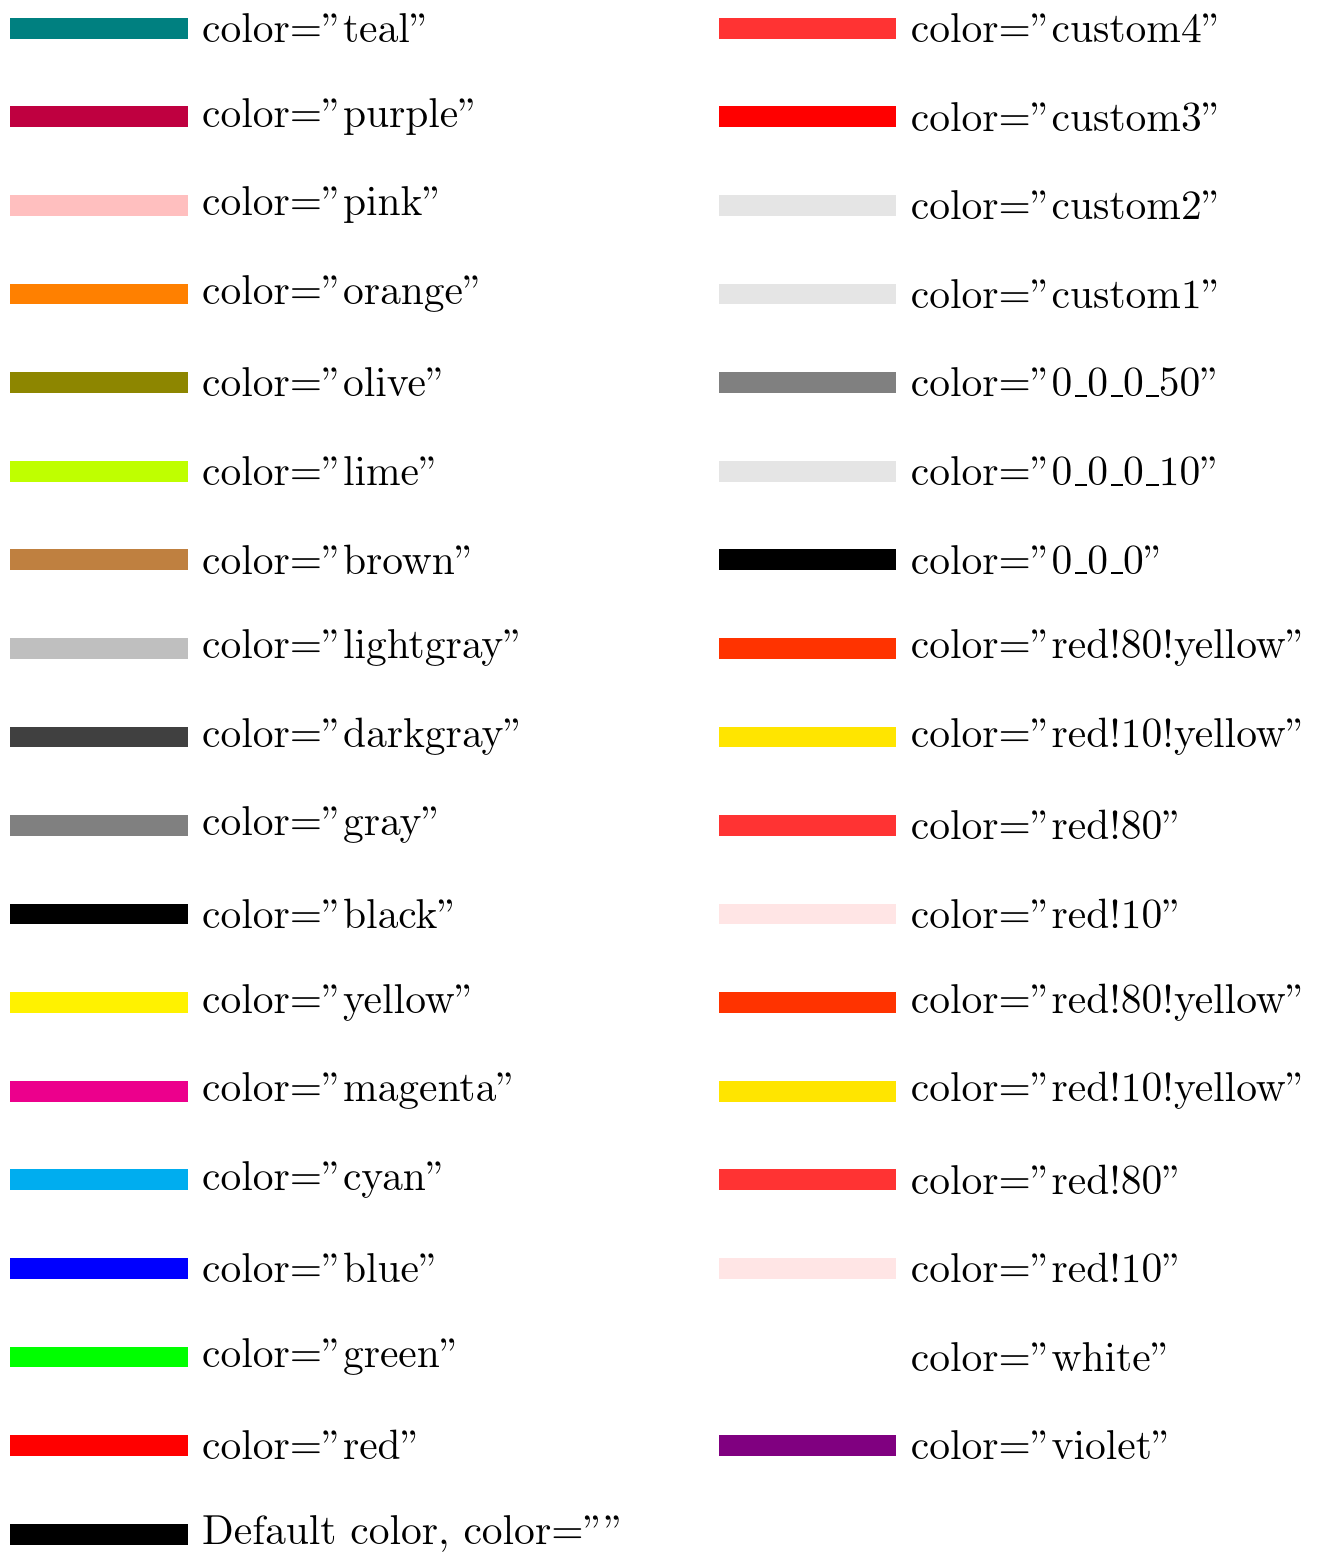
Example 3 - Color property options
Available color inputs for the color property:
The shapes color property can set in three different ways by the default names, by color tranparency, by a rgb definition or custom colors can be added in the colors object. As in the following examples:
color = “color name” , Color name
color = “color1!30” , Transparency of a color
color = “color1!30!color2” , Tranparency between two colors
color = “r_g_b” , RGB values. Scale 0-255.
color = “r_g_b_trans” , RGB values + transparency. Scale 0-255.
calor = “custom name” , names defined in the colors object
note that can also be used the transparent!30 color, to create transparencies.
Drawing created with the following tikzpy code:
 1# python3
 2
 3### Load tikzpy library
 4import os, sys
 5import tikzpy as py_tikZ
 6
 7### Load main object
 8tikZ = py_tikZ.load()
 9tikZ.scale = 1.00
10tikZ.scale_text = 1.00
11
12### Add point at x=0, y=0, z=0
13p1 = tikZ.pto.pto(0,0,0, layer=0, alias='pto1')
14p2 = tikZ.pto.pto(1.5,0,0, layer=0, alias='pto2')
15
16### First line
17l = tikZ.shp.line(p1,p2, thick="5", color="white") #Due to tranparent background
18l.zorder = -1
19l = tikZ.shp.line(p1,p2, thick="5", color="") #Default case
20l.zorder = 1
21tx = tikZ.shp.text(p2, "Default color, color=\"\"", layer = 0)
22tx.position = "right"
23
24# Types of line
25colors = tikZ.col._default
26in_y = 0.75
27in_x = 6
28
29# Add custom colors
30direct_custom = ["red!10","red!80","red!10!yellow","red!80!yellow"]
31colors = colors + direct_custom
32direct_custom = ["red!10","red!80","red!10!yellow","red!80!yellow"]
33colors = colors + direct_custom
34direct_custom = ["0_0_0","0_0_0_10","0_0_0_50"]
35colors = colors + direct_custom
36
37# Add custom colors with object color
38tikZ.col["custom1"] = "black!10"
39tikZ.col["custom2"] = "0_0_0_10"
40tikZ.col["custom3"] = "red"
41tikZ.col["custom4"] = "red!80"
42colors = colors + ["custom1","custom2","custom3","custom4"]
43
44#Iterate types
45ii = 1
46for col in colors:
47    p1 = p1.copy()
48    p2 = p2.copy()
49    p1.y = p1.y + in_y
50    p2.y = p2.y + in_y
51    print( col)
52    l = tikZ.shp.line(p1,p2, thick="5", color="white")
53    l.zorder = -1
54    l = tikZ.shp.line(p1,p2, thick="5", color=col)
55    l.zorder = 1
56    tx = tikZ.shp.text(p2, "color=\"%s\"" % col.replace("_", "\\_"), layer = 0)
57    tx.position = "right"
58    tx.zorder = 1
59    ii = ii + 1
60    if ii == 18:
61        p1 = tikZ.pto.alias('pto1').copy()
62        p2 = tikZ.pto.alias('pto2').copy()
63        p1.x = p1.x + in_x
64        p2.x = p2.x + in_x
65
66#Number of colors
67print( "Num colors: %i" % tikZ.col.num_colors)
68
69### Make drawing
70path = os.path.dirname(os.path.abspath(__file__))
71name = os.path.basename(os.path.abspath(__file__))
72name = os.path.splitext(name)[0]
73tikZ.save_pdf(path, name, as_png = True)
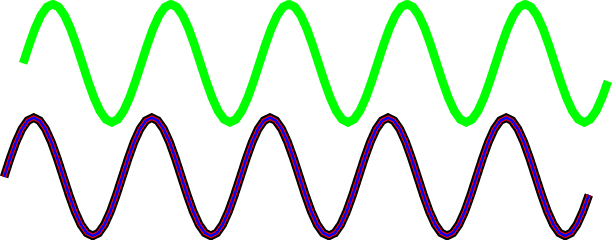
Example 4 - Add points property addpto
Points can be added to shapes in the followin formats:
addpto = point object , as a point object
addpto = [point object] , as a list of point objects
addpto = point.id , by point id
addpto = [point.id] , as a list of point ids
addpto = point.alias , by point id
addpto = [point.alias] , as a list of point alias
See the following example:
Drawing created with the following tikzpy code:
 1# python3
 2
 3### Load tikzpy library
 4import os, sys
 5import math
 6import tikzpy as py_tikZ
 7
 8tikZ = py_tikZ.load()
 9
10### Create a list points according a sinus
11f=1.
12total = 100.
13
14lst_ids = []
15lst_pto = []
16lst_alias = []
17
18for i in range(0, int(total)):
19    x = (5. / total) * i
20    y = 0.5*math.sin(2*math.pi*f*x)
21
22    alias = 'pto%i' % i
23    p = tikZ.pto.pto(x,y,0, layer=0, alias=alias)
24
25    ### Create list
26    lst_ids.append(p.id)
27    lst_pto.append(p)
28    lst_alias.append(alias)
29
30### Draw a path of points by ids
31l1 = tikZ.shp.path(lst_ids, layer = 0, color = "black", thick = "2")
32l1.zorder = 0
33#See points in line
34print( l1.addpto)
35
36### Draw a path of points by pto
37l2 = tikZ.shp.path(lst_pto, layer = 0, color = "red", thick = "1")
38l2.zorder = 1
39#See points in line
40print( l2.addpto)
41
42### Draw a path of points by pto
43l3 = tikZ.shp.path(lst_alias, layer = 0, color = "blue", thick = "0.5")
44l3.zorder = 2
45#See points in line
46print( l3.addpto)
47
48### Copy an translate
49lst_copy = tikZ.pto.copy(l3.addpto, alias_prefix = "(", alias_sufix = ")")
50print( lst_copy, "-",lst_copy[0])
51l4 = tikZ.shp.path(lst_copy, layer = 0, color = "green", thick = "2")
52l4.zorder = 3
53# translate
54tikZ.pto.translate(lst_copy, x = 0.2, y = 1., z = 0.1)
55
56### Make drawing
57path = os.path.dirname(os.path.abspath(__file__))
58name = os.path.basename(os.path.abspath(__file__))
59name = os.path.splitext(name)[0]
60tikZ.save_pdf(path, name)
Example 5 - Text shape options
See the following example:
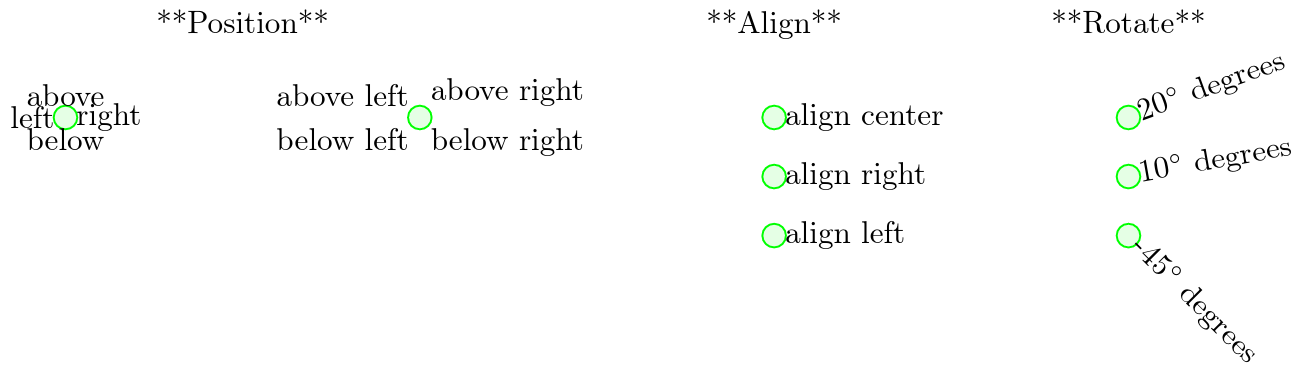
Drawing created with the following tikzpy code:
 1# python3
 2
 3### Load tikzpy library
 4import os, sys
 5import tikzpy as py_tikZ
 6
 7### Load main object
 8tikZ = py_tikZ.load()
 9tikZ.scale_text=0.75
10
11### Text label
12p = tikZ.pto.pto(1.5, 0, 0)
13txt = tikZ.shp.text(p, "**Position**", layer=0, color='', fill='', rotate_text=0, position='below', align='center')
14
15p = tikZ.pto.pto(0, -1, 0)
16tikZ.shp.circle(p, 0.1, layer=0, thick='', type='', color='green', fill='green!10')
17txt = tikZ.shp.text(p, "above", layer=0, color='', fill='', rotate_text=0, position='above', align='')
18txt = tikZ.shp.text(p, "below", layer=0, color='', fill='', rotate_text=0, position='below', align='')
19txt = tikZ.shp.text(p, "left", layer=0, color='', fill='', rotate_text=0, position='left', align='')
20txt = tikZ.shp.text(p, "right", layer=0, color='', fill='', rotate_text=0, position='right', align='')
21
22p = tikZ.pto.pto(3, -1, 0)
23tikZ.shp.circle(p, 0.1, layer=0, thick='', type='', color='green', fill='green!10')
24txt = tikZ.shp.text(p, "above left", layer=0, color='', fill='', rotate_text=0, position='above left', align='')
25txt = tikZ.shp.text(p, "below left", layer=0, color='', fill='', rotate_text=0, position='below left', align='')
26txt = tikZ.shp.text(p, "above right", layer=0, color='', fill='', rotate_text=0, position='above right', align='')
27txt = tikZ.shp.text(p, "below right", layer=0, color='', fill='', rotate_text=0, position='below right', align='')
28
29
30p = tikZ.pto.pto(6, 0, 0)
31txt = tikZ.shp.text(p, "**Align**", layer=0, color='', fill='', rotate_text=0, position='below', align='center')
32
33p = tikZ.pto.pto(6, -1, 0)
34tikZ.shp.circle(p, 0.1, layer=0, thick='', type='', color='green', fill='green!10')
35txt = tikZ.shp.text(p, "align center", layer=0, color='', fill='', rotate_text=0, position='right', align='center')
36p = tikZ.pto.pto(6, -1.5, 0)
37tikZ.shp.circle(p, 0.1, layer=0, thick='', type='', color='green', fill='green!10')
38txt = tikZ.shp.text(p, "align right", layer=0, color='', fill='', rotate_text=0, position='right', align='right')
39p = tikZ.pto.pto(6, -2, 0)
40tikZ.shp.circle(p, 0.1, layer=0, thick='', type='', color='green', fill='green!10')
41txt = tikZ.shp.text(p, "align left", layer=0, color='', fill='', rotate_text=0, position='right', align='left')
42
43p = tikZ.pto.pto(9, 0, 0)
44txt = tikZ.shp.text(p, "**Rotate**", layer=0, color='', fill='', rotate_text=0, position='below', align='center')
45
46p = tikZ.pto.pto(9, -1, 0)
47tikZ.shp.circle(p, 0.1, layer=0, thick='', type='', color='green', fill='green!10')
48txt = tikZ.shp.text(p, "20$^\\circ$ degrees", layer=0, color='', fill='', rotate_text=20, position='right', align='center')
49p = tikZ.pto.pto(9, -1.5, 0)
50tikZ.shp.circle(p, 0.1, layer=0, thick='', type='', color='green', fill='green!10')
51txt = tikZ.shp.text(p, "10$^\\circ$ degrees", layer=0, color='', fill='', rotate_text=10, position='right', align='right')
52p = tikZ.pto.pto(9, -2, 0)
53tikZ.shp.circle(p, 0.1, layer=0, thick='', type='', color='green', fill='green!10')
54txt = tikZ.shp.text(p, "-45$^\\circ$ degrees", layer=0, color='', fill='', rotate_text=-45, position='right', align='left')
55
56
57### Make drawing
58path = os.path.dirname(os.path.abspath(__file__))
59name = os.path.basename(os.path.abspath(__file__))
60name = os.path.splitext(name)[0]
61tikZ.save_pdf(path, name)
62
63
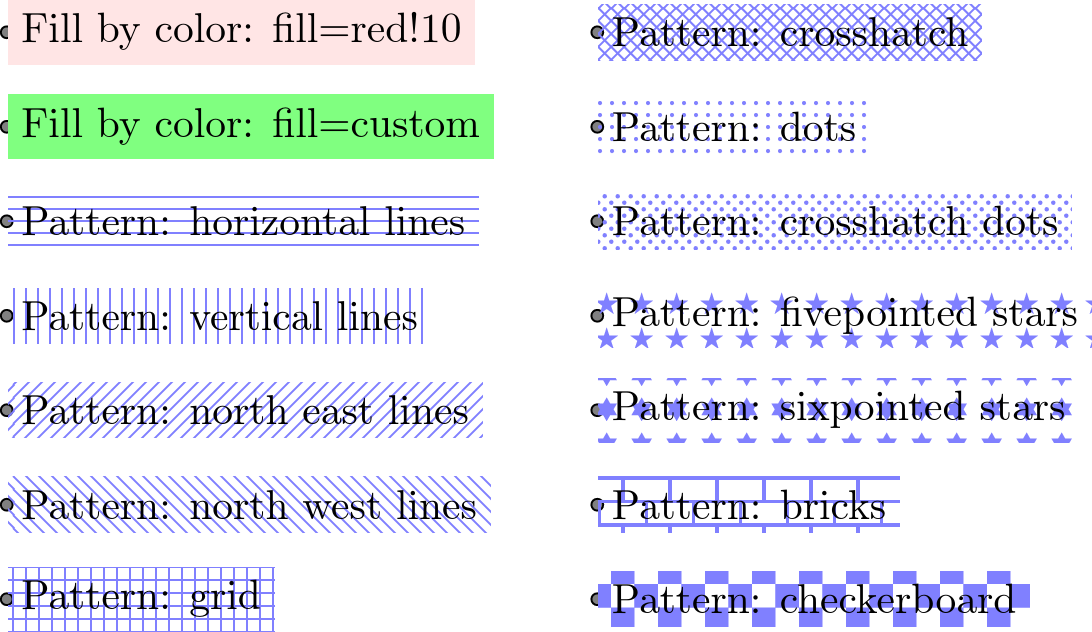
Example 6 - Fill properties options
Available fill inputs values for the fill property:
By color, in a similar way that is color property (see colors examples)
fill = “color name” , Color name
fill = “color1!30” , Transparency of a color
fill = “color1!30!color2” , Tranparency between two colors
fill = “r_g_b” , RGB values. Scale 0-255.
fill = “r_g_b_trans” , RGB values + transparency. Scale 0-255.
fill = “custom name” , names defined in the colors object
With a pattern
the pattern is create with the function pattern_build(pattern,color)
With a shade path (see section 41 TikZ manual)
the shade path is create with the function
see following examples:
Drawing created with the following tikzpy code:
 1# python3
 2
 3### Load tikzpy library
 4import os, sys
 5import tikzpy as py_tikZ
 6
 7### Load main object
 8tikZ = py_tikZ.load()
 9tikZ.scale = 1.00
10tikZ.scale_text = 1.00
11rad = 0.05
12iy = -0.8
13ix = 5
14
15def _new_p(p, ix, iy):
16    _p = p.copy()
17    _p.y = _p.y + iy
18    _p.x = _p.x + ix
19    return _p
20
21### Add point at x=0, y=0, z=0
22p = tikZ.pto.pto(0,0,0)
23tx = tikZ.shp.circle(p, rad, layer = 0, fill="0_0_0_50")
24tx = tikZ.shp.text(p, "Fill by color: fill=red!10", layer = 0, fill="red!10", position = "right")
25
26p=_new_p(p, 0, iy)
27tikZ.col["custom"] = "green!50"
28tx = tikZ.shp.circle(p, rad, layer = 0, fill="0_0_0_50")
29tx = tikZ.shp.text(p, "Fill by color: fill=custom", layer = 0, fill="custom", position = "right")
30
31ii = 0
32for pattern_type in tikZ.shp._types_patterns():
33
34    if ii == 5:
35        p = tikZ.pto.pto(ix,0,0)
36    else:
37        p=_new_p(p, 0, iy)
38    pattern1 = tikZ.shp.pattern_build(pattern_type, color = "blue!50")
39    tx = tikZ.shp.circle(p, rad, layer = 0, fill="0_0_0_50")
40    tx = tikZ.shp.text(p, "Pattern: %s" % pattern_type, layer = 0, fill=pattern1, position = "right")
41
42    ii += 1
43
44### Make drawing
45path = os.path.dirname(os.path.abspath(__file__))
46name = os.path.basename(os.path.abspath(__file__))
47name = os.path.splitext(name)[0]
48tikZ.save_pdf(path, name, as_png = True)
49
50
51
Example 7 - Grid shape options
See the following example:
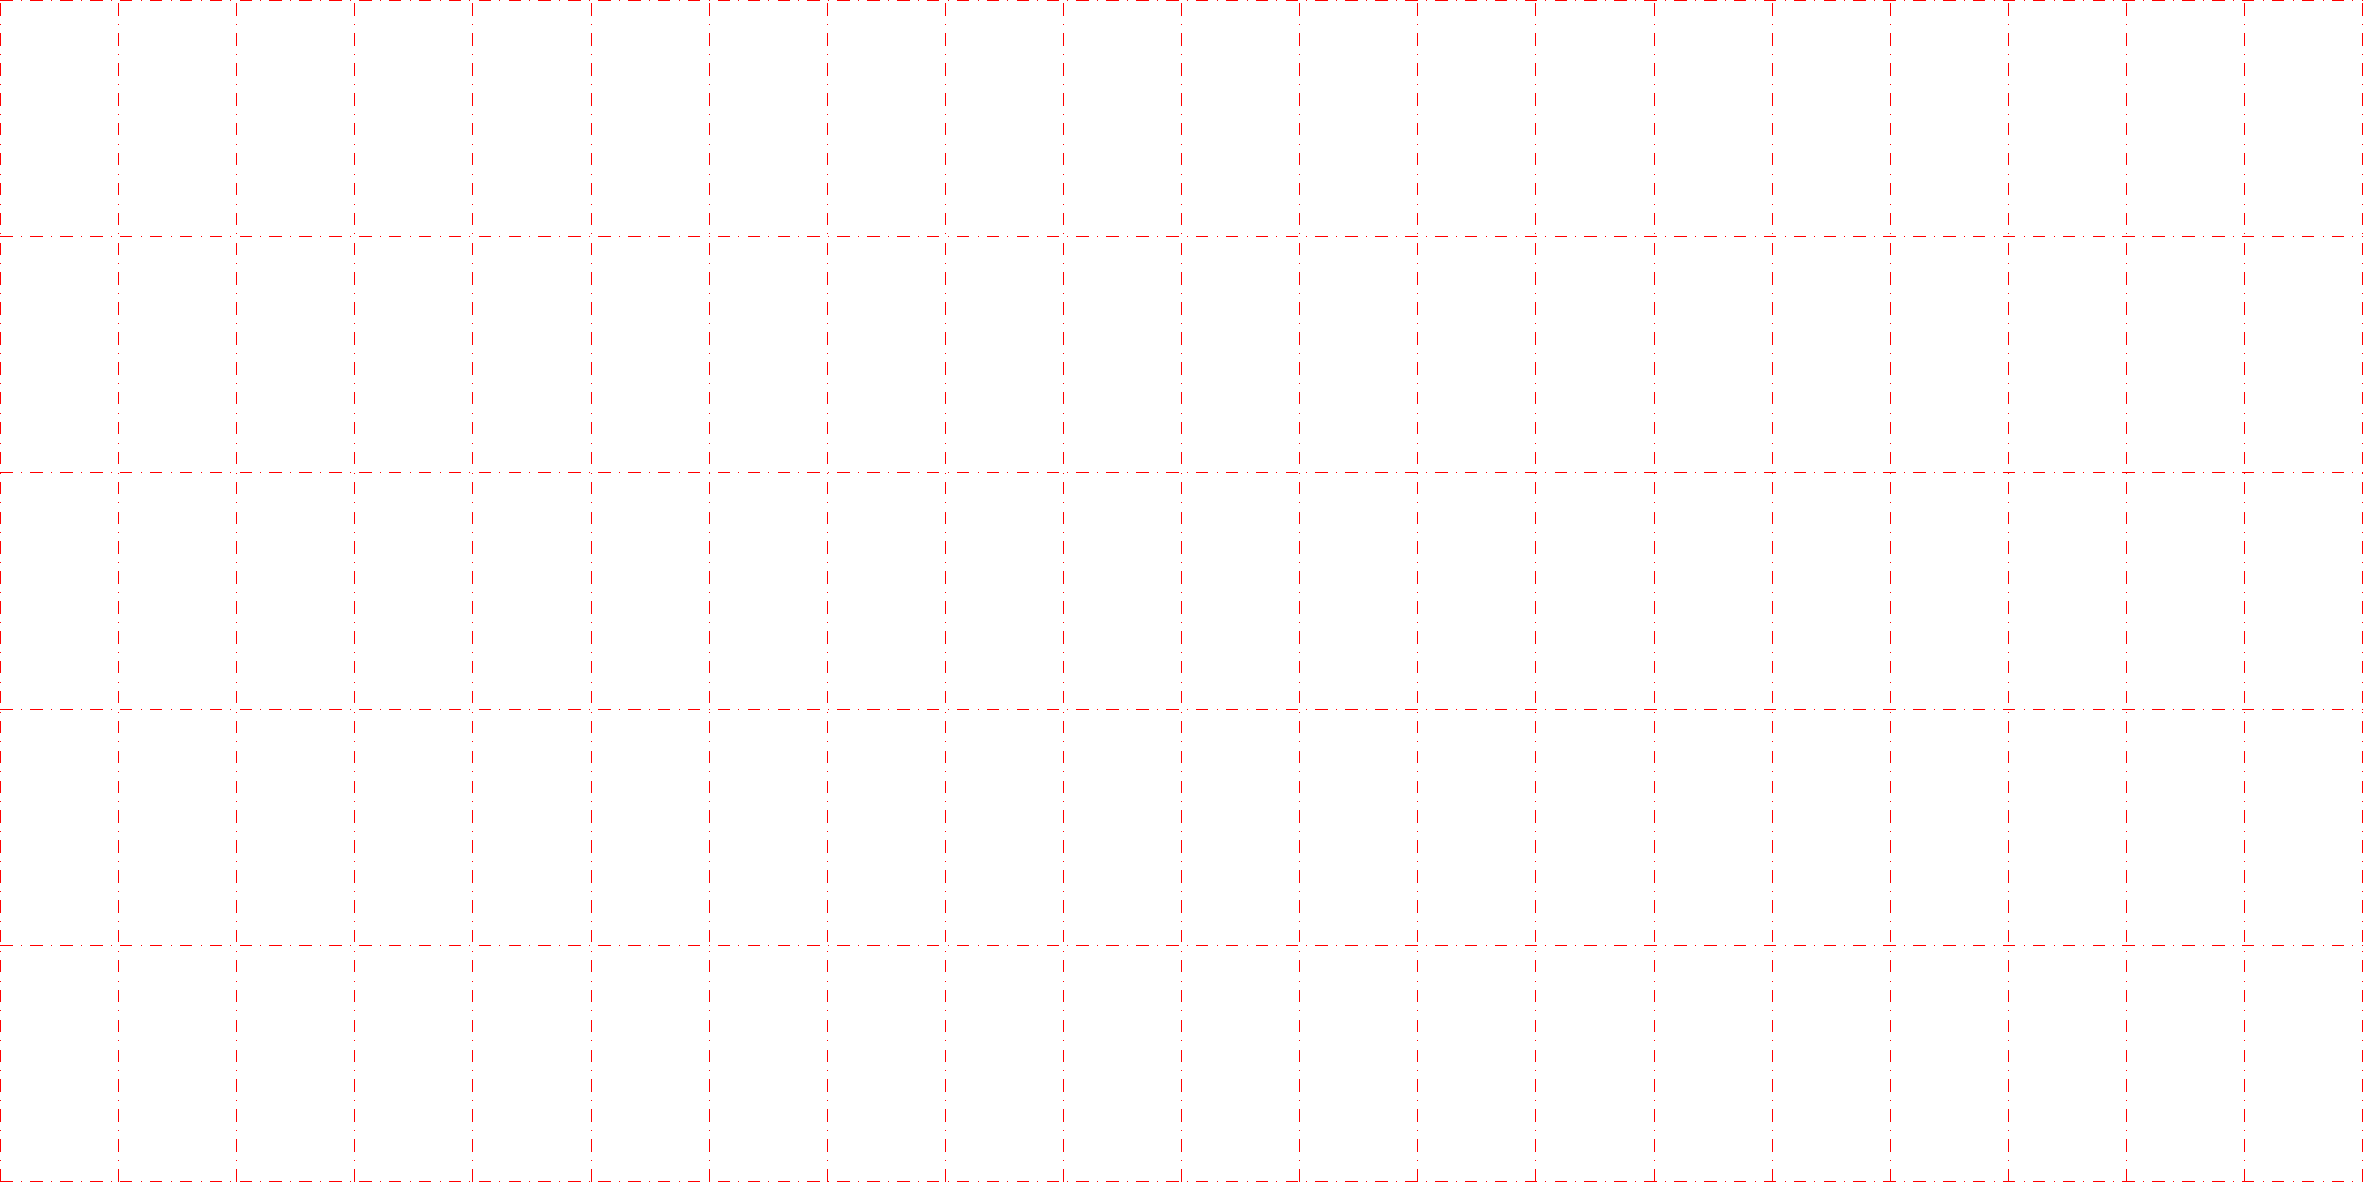
Drawing created with the following tikzpy code:
 1# python3
 2
 3### Load tikzpy library
 4import os, sys
 5import tikzpy as py_tikZ
 6
 7### Load main object
 8tikZ = py_tikZ.load()
 9
10
11### Text label
12p1 = tikZ.pto.pto(0, 0, 0)
13p2 = tikZ.pto.pto(20, 10, 0)
14
15tikZ.shp.grid(p1,p2, xstep = 1, ystep = 2, layer = 0, thick = "help lines", type = "dashdotted", color = "red")
16
17### Make drawing
18path = os.path.dirname(os.path.abspath(__file__))
19name = os.path.basename(os.path.abspath(__file__))
20name = os.path.splitext(name)[0]
21tikZ.save_pdf(path, name)
22
23
Example 8 - Bitmap shape options
See the following example:
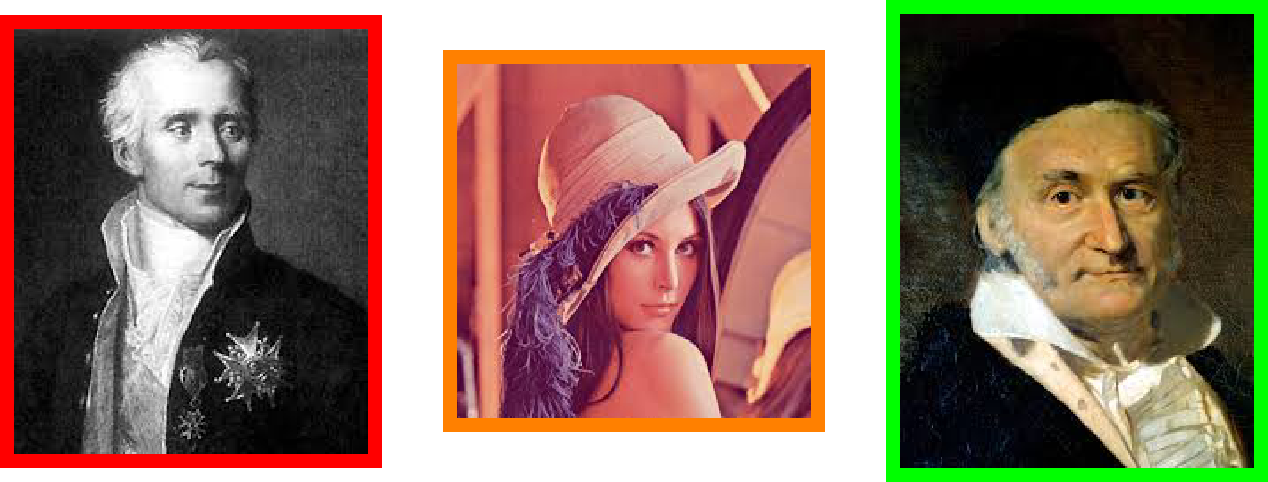
Drawing created with the following tikzpy code:
 1# python3
 2
 3### Load tikzpy library
 4import os, sys
 5import tikzpy as py_tikZ
 6
 7### Load main object
 8tikZ = py_tikZ.load()
 9tikZ.scale=0.75
10
11### Text label
12p = tikZ.pto.pto(-5, 0, 0)
13bitmap_path = os.path.dirname(os.path.abspath(__file__))
14bitmap_path = os.path.join(bitmap_path, "laplace.jpg")
15txt = tikZ.shp.bitmap(p, bitmap_path, width=3, height=None, layer=0, color='', fill='red', rotate_text=0, position='', align='')
16
17p = tikZ.pto.pto(0, 0, 0)
18bitmap_path = os.path.dirname(os.path.abspath(__file__))
19bitmap_path = os.path.join(bitmap_path, "lena_01.jpg")
20txt = tikZ.shp.bitmap(p, bitmap_path, width=3, height=None, layer=0, color='', fill='orange', rotate_text=0, position='', align='')
21
22p = tikZ.pto.pto(5, 0, 0)
23bitmap_path = os.path.dirname(os.path.abspath(__file__))
24bitmap_path = os.path.join(bitmap_path, "gauss.jpg")
25txt = tikZ.shp.bitmap(p, bitmap_path, width=3, height=None, layer=0, color='', fill='green', rotate_text=0, position='', align='')
26
27### Make drawing
28path = os.path.dirname(os.path.abspath(__file__))
29name = os.path.basename(os.path.abspath(__file__))
30name = os.path.splitext(name)[0]
31tikZ.save_pdf(path, name)
32
33
Example 9 - Arrow tip types
Available arrow tips types:
A selected list of arrow tips are listed below (extracted from page 311 pgfmanualCVS2012-11-04),
Drawing created with the following tikzpy code:
 1# python3
 2
 3### Load tikzpy library
 4import os, sys
 5import tikzpy as py_tikZ
 6
 7### Load main object
 8tikZ = py_tikZ.load()
 9tikZ.scale = 1.00
10tikZ.scale_text = 1.00
11
12### Add point at x=0, y=0, z=0
13p1 = tikZ.pto.pto(0,0,0, layer=0, alias='pto1')
14p2 = tikZ.pto.pto(1.5,0,0, layer=0, alias='pto2')
15
16tipstypes = ["latex","stealth","triangle 90","triangle 60","triangle 45","open triangle 90","open triangle 60","open triangle 45", "angle 90", "angle 60", "angle 45", "hooks"]
17tipstypes += ["latex reversed","stealth reversed","triangle 90 reversed","triangle 60 reversed","triangle 45 reversed","open triangle 90 reversed","open triangle 60 reversed","open triangle 45 reversed", "angle 90 reversed", "angle 60 reversed", "angle 45 reversed", "hooks reversed", "o", "*", "diamond", "square"]
18
19### First line
20l = tikZ.shp.line(p1,p2) #Due to tranparent background
21tikZ.shp.arrow_to_shapes(l, start=tipstypes[0], end=tipstypes[0], scale=1.)
22tx = tikZ.shp.text(p2, "type: %s" % tipstypes[0], layer = 0)
23tx.position = "right"
24
25# Types of line
26in_y = -0.75
27in_x = 6
28
29#Iterate types
30ii = 1
31for jj in range(1,len(tipstypes)):
32    p1 = p1.copy()
33    p2 = p2.copy()
34    p1.y = p1.y + in_y
35    p2.y = p2.y + in_y
36
37    l = tikZ.shp.line(p1,p2) #Due to tranparent background
38    tikZ.shp.arrow_to_shapes(l, start=tipstypes[ii], end=tipstypes[ii], scale=1.)
39    tx = tikZ.shp.text(p2, "type: %s" % tipstypes[ii], layer = 0)
40    tx.position = "right"
41
42    ii = ii + 1
43    if ii == 15:
44        p1 = tikZ.pto.alias('pto1').copy()
45        p2 = tikZ.pto.alias('pto2').copy()
46        p1.x = p1.x + in_x
47        p2.x = p2.x + in_x
48
49### Make drawing
50path = os.path.dirname(os.path.abspath(__file__))
51name = os.path.basename(os.path.abspath(__file__))
52name = os.path.splitext(name)[0]
53tikZ.save_pdf(path, name, as_png = True)
54
55