How to use build-in plots tikzpy.plots
Examples of how to use the shape objects tikzpy.plots.
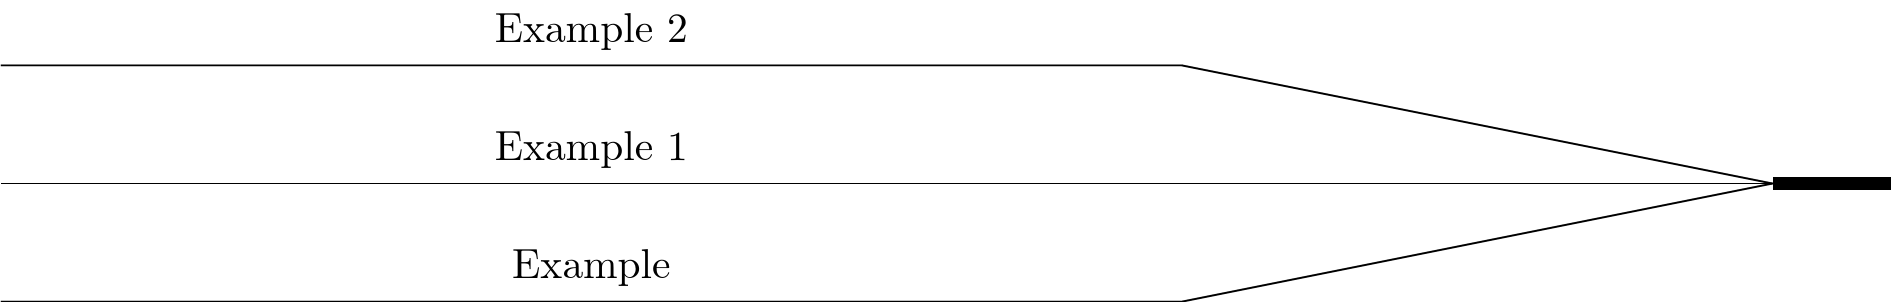
Plot racimes 1 - Draws a racime plot
The build-in plot draws a racime plot.
Drawing created with the following tikzpy code:
 1# python3
 2
 3### Load tikzpy library
 4import os, sys
 5import tikzpy as py_tikZ
 6
 7### Load main object
 8tikZ = py_tikZ.load()
 9tikZ.dpi=300
10
11### Add point at x=0, y=0, z=0
12p0 = tikZ.pto.pto(0,0,0)
13
14### Add point at x=1, y=1, z=1
15p1 = tikZ.pto.pto(1,1,1)
16
17### Assembly type racime
18rac = tikZ.plots.racime(group = 0)
19rac.l1 = 10.             #Add length 1 value
20rac.l2 = 5.              #Add length 2 value
21rac.l3 = 1.              #Add length 3 value
22rac.origin = p0          #Add point
23
24rac.add_element("Example", thickness = None, separation = None)
25rac.add_element("Example 1", thickness = None, separation = None)
26rac.add_element("Example 2", thickness = None, separation = None)
27rac.move(p1-p0)          #Move assembly
28rac.addlabel="patatin"   #Add a label
29
30### Make drawing
31path = os.path.dirname(os.path.abspath(__file__))
32name = os.path.basename(os.path.abspath(__file__))
33name = os.path.splitext(name)[0]
34tikZ.save_pdf(path, name)
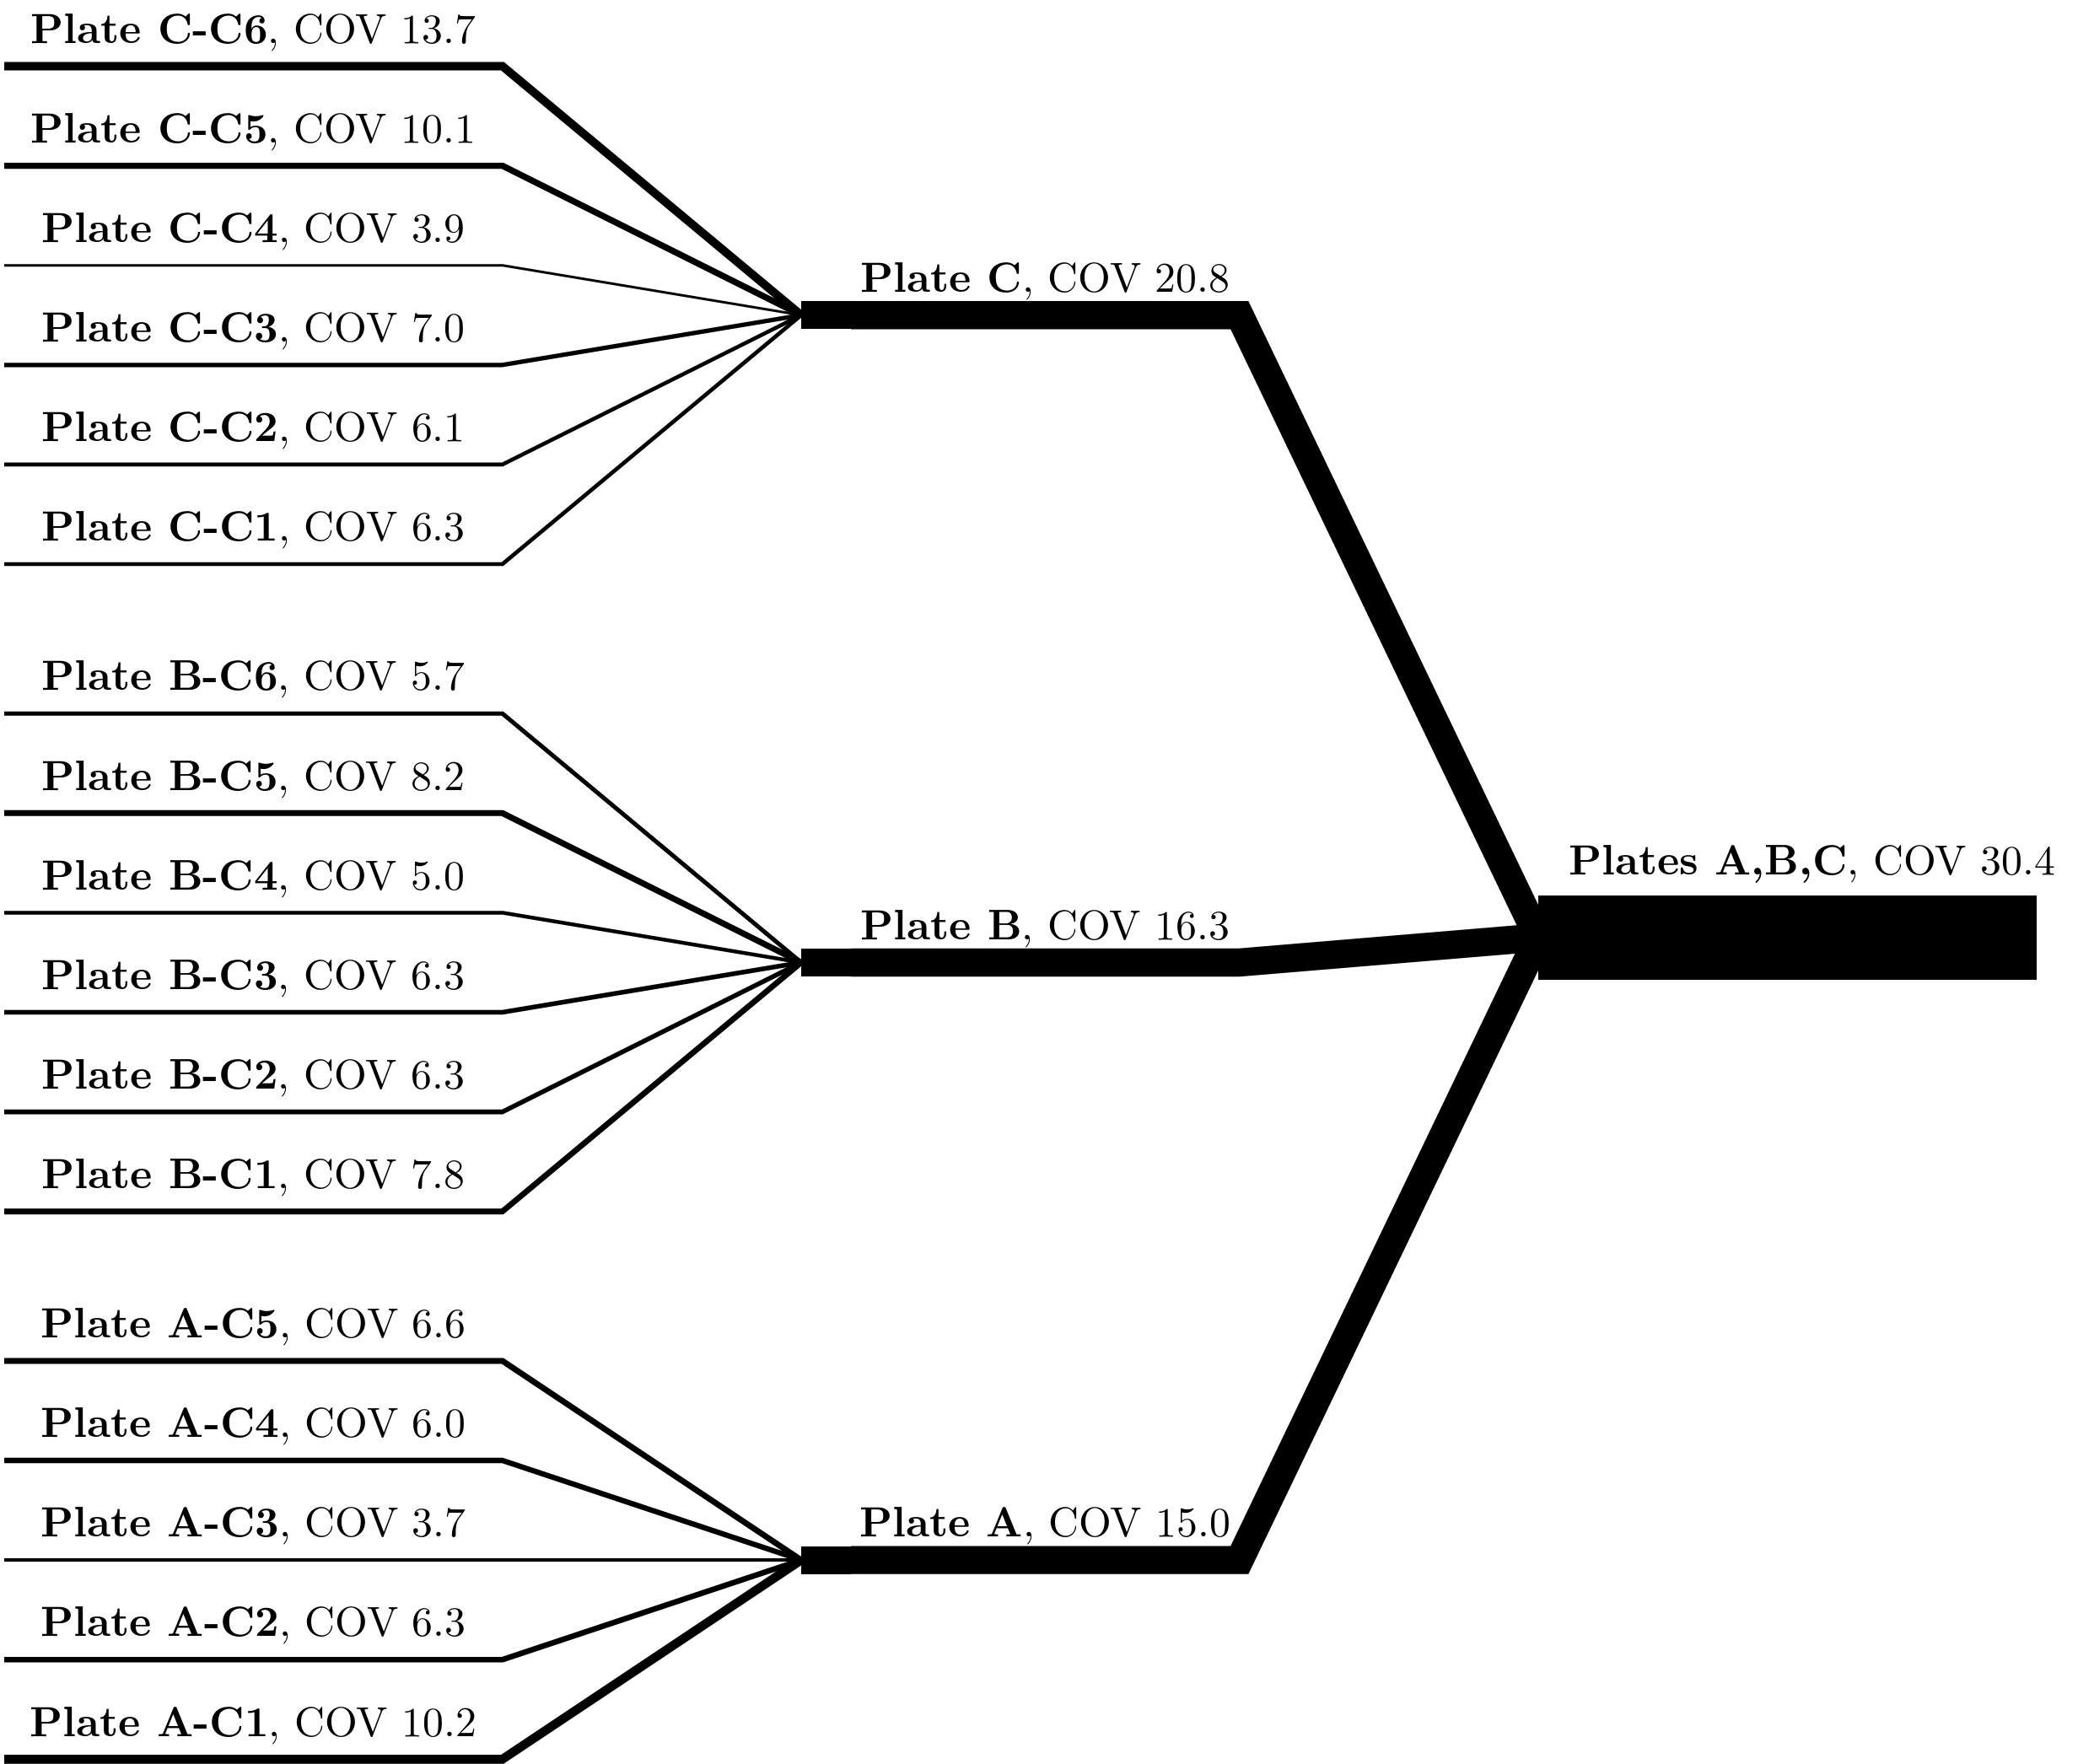
Plot racimes 2 - Scatter propagation plot
The build-in plot draws a racime plot.
Drawing created with the following tikzpy code:
  1# python3
  2
  3### Load tikzpy library
  4import os, sys
  5import numpy as np
  6import tikzpy as py_tikZ
  7
  8class pic_scatter_prop(object):
  9
 10    def __init__(self):
 11
 12        self.tik = py_tikZ.pytikz()
 13
 14    def run(self):
 15
 16        self.tik.scale = 1.00
 17        self.tik.scale_text = 1.20
 18
 19        self.points()
 20        self.drawing_comp()
 21
 22        ### Make drawing
 23        path = os.path.dirname(os.path.abspath(__file__))
 24        name = os.path.basename(os.path.abspath(__file__))
 25        name = os.path.splitext(name)[0]
 26        self.tik.save_pdf(path, name, as_png = True)
 27
 28    def points(self):
 29
 30        self.p0 = self.tik.pto.pto(0,0,0)
 31        self.p1 = self.tik.pto.pto(1,1,0)
 32
 33        xserie = [4.19, 14.86, 28.96, 39.25, 50.31]
 34        xserie1 = [4, 15.2, 26.4, 37.6, 48.8, 60]
 35
 36        self.names = ["-C1", "-C2", "-C3", "-C4", "-C5", "-C6"]
 37
 38        self.WI_avg = [719.4, 769.6, 837.8, 822.2, 685.1]
 39        self.WI_std = [73.3016565, 48.3582111, 30.71350422, 49.4786026, 45.27070637]
 40
 41        self.WJ_avg = [623.1, 629.8, 670.1, 707.9, 671.3, 589.5]
 42        self.WJ_std = [48.49166303, 39.85523282, 41.96451536, 35.58120776, 54.91708268, 33.78103112]
 43
 44        self.WM_avg = [739.9, 725.1, 698.2, 700.7, 755.6, 709.2]
 45        self.WM_std = [46.37049136, 44.43828625, 48.93533058, 27.24455085, 76.17562546, 96.96469509]
 46
 47        self.WJ_avg_ten = [862.9127972, 885.3821492, 864.2301528, 853.1920925, 886.1908006]
 48        self.WJ_std_ten = [34.12315274, 20.53210185, 37.15676289, 31.62798934, 27.26881549]
 49
 50        self.WM_avg_ten = [856.7283735, 828.5132667, 799.5322142, 829.2538277, 850.4567135]
 51        self.WM_std_ten = [30.88654937, 25.27209811, 22.05096108, 34.11512839, 20.77847733]
 52
 53        self.WJ_avg_ILSS = [32.44955411, 34.68039656, 39.34979163, 40.93728194, 32.55181904]
 54        self.WJ_std_ILSS = [1.876029752, 0.653081672, 1.677962676, 1.965138951, 1.705132996]
 55
 56        self.WM_avg_ILSS = [35.32078312, 32.60281401, 31.040988, 33.62553998, 36.70709027]
 57        self.WM_std_ILSS = [0.890769464, 1.083362528, 1.217875935, 1.007511884, 1.06591193]
 58
 59    def drawing_comp(self, option = 0):
 60
 61        shps = []
 62
 63        vals = [1, 5, 3, 0.5, 8.]
 64        [sep, l1, l2, l3,thick] = vals
 65
 66        def draw(p, avg, std, name, txt, shps, vals, separation=[], thickness=[]):
 67
 68            [sep, l1, l2, l3,thick] = vals
 69
 70            ## Calc
 71            rac = self.tik.plots.racime(group = 0)
 72            rac.l1 = l1
 73            rac.l2 = l2
 74            rac.l3 = l3
 75            rac.separation = sep
 76            rac.origin = self.p0
 77
 78            cov_tot = 0
 79            for i in range(0,len(avg)):
 80                cov = std[i]*100./avg[i]
 81                cov_tot = cov_tot + cov
 82
 83            for i in range(0,len(avg)):
 84
 85                cov = std[i]*100./avg[i]
 86                if separation == []:
 87                    rac.add_element("\\textbf{%s%s}, COV %.1f" %(txt,name[i],cov), thickness = thick*cov/cov_tot)
 88                else:
 89                    rac.add_element("\\textbf{%s%s}, COV %.1f" %(txt,name[i],cov), thickness = thickness[i], separation=separation[i])
 90
 91            rac.move(p)
 92            rac.addlabel="patatin"
 93            shps.append(rac)
 94
 95            return rac
 96
 97        WI_avg, WI_std = self.WI_avg, self.WI_std
 98        WJ_avg, WJ_std = self.WJ_avg, self.WJ_std
 99        WM_avg, WM_std = self.WM_avg, self.WM_std
100
101        p = self.p0
102        racWI = draw(p, WI_avg, WI_std, self.names, "Plate A", shps, vals)
103
104        p.y = p.y + racWI.total_height + 1.5* sep
105        racWJ = draw(p, WJ_avg, WJ_std, self.names, "Plate B", shps, vals)
106
107        p.y = p.y + racWJ.total_height + 1.5* sep
108        racWM = draw(p, WM_avg, WM_std, self.names, "Plate C", shps, vals)
109
110        p = racWI.p_vertex[0]
111        def plate_calcs(avg, std):
112            mean = np.mean(avg)
113            sq_sum = np.sum(np.asarray(std)**2.) #/ (len(std)**2.)
114            std = sq_sum**0.5
115            return mean, std
116
117        vals = [1, 3.9, 3, 0.5, 8.]
118        [sep, l1, l2, l3,thick] = vals
119        meanWI, stdWI = plate_calcs(WI_avg, WI_std)
120        meanWJ, stdWJ = plate_calcs(WJ_avg, WJ_std)
121        meanWM, stdWM = plate_calcs(WM_avg, WM_std)
122        avg = [meanWI, meanWJ, meanWM]
123        std = [stdWI, stdWJ, stdWM]
124        names = ["\\textbf{Plate A}","\\textbf{Plate B}","\\textbf{Plate C}"]
125        separation = [racWI.total_height/2. + 1.5* sep+ racWJ.total_height/2.,racWJ.total_height/2. + 1.5* sep+ racWM.total_height/2.,0]
126        thickness = [racWI.end_thickness,racWJ.end_thickness,racWM.end_thickness]
127
128        racplate = draw(p, avg, std, names, "", shps, vals, separation=separation, thickness=thickness)
129
130        meanPlates, stdPlates = plate_calcs(avg, std)
131        #meanPlates, stdPlates = plate_calcs(self.WI_avg+self.WJ_avg+self.WM_avg, self.WI_std+self.WJ_std+self.WM_std)
132        COVplates = stdPlates*100./meanPlates
133
134        pp = racplate.p_vertex[0]
135        p = racplate.p_vertex[0]
136        p.x = p.x + l2*1.5
137        l1 = self.tik.shp.line(pp,p,layer=0)
138
139        if thickness: l1.thick = racplate.end_thickness
140        shps.append(l1)
141
142        p = racplate.p_vertex[0]
143        p.x = p.x + l2*1.5/2.
144        p.y = p.y + 0.4
145        l = self.tik.shp.text(p, "\\textbf{Plates A,B,C}, COV %.1f" % COVplates,0)
146        l.align = 0
147        l.position = "above"
148        shps.append(l)
149
150if __name__ == "__main__":
151
152    obj = pic_scatter_prop()
153
154    obj.run()
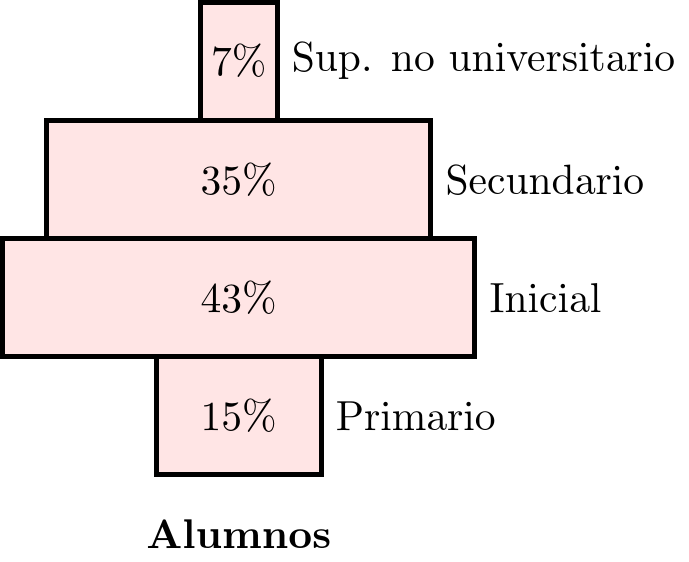
Plot Vertical bars plot 1
The build-in plot draws a vertical bars plot.
Drawing created with the following tikzpy code:
 1# python3
 2
 3### Load tikzpy library
 4import os, sys
 5import tikzpy as py_tikZ
 6import numpy as np
 7
 8### Load main object
 9tikZ = py_tikZ.load()
10tikZ.dpi=300
11
12### Add point at x=0, y=0, z=0
13p0 = tikZ.pto.pto(0,0,0)
14
15### Assembly type racime
16vbar = tikZ.plots.bars_vertical(group = 0)
17
18N = 4
19data_buff = tikZ.dbuffer.load_empty_dbuff(N)
20vbar.lbl_axis0 = "axis0"
21data_buff[vbar.lbl_axis0] = np.asarray([15,	43,	35,	7])
22vbar.lbl_label1 = "axis1"
23data_buff[vbar.lbl_label1] = np.asarray(["15\\%", "43\\%", "35\\%", "7\\%"])
24vbar.lbl_label2 = "axis2"
25data_buff[vbar.lbl_label2] = np.asarray(["Primario","Inicial","Secundario","Sup. no universitario"])
26vbar.title = "\\textbf{Alumnos}"
27vbar.load_data_buffer(data_buff)
28
29vbar.width = 4
30vbar.p0 = p0
31
32vbar.draw_plot()
33# Changeline type & fill
34tikZ.shp.fill_to_shapes(vbar.lst_path0, "red!10")
35tikZ.shp.thick_to_shapes(vbar.shps, "very thick")
36
37### Make drawing
38path = os.path.dirname(os.path.abspath(__file__))
39name = os.path.basename(os.path.abspath(__file__))
40name = os.path.splitext(name)[0]
41tikZ.save_pdf(path, name)
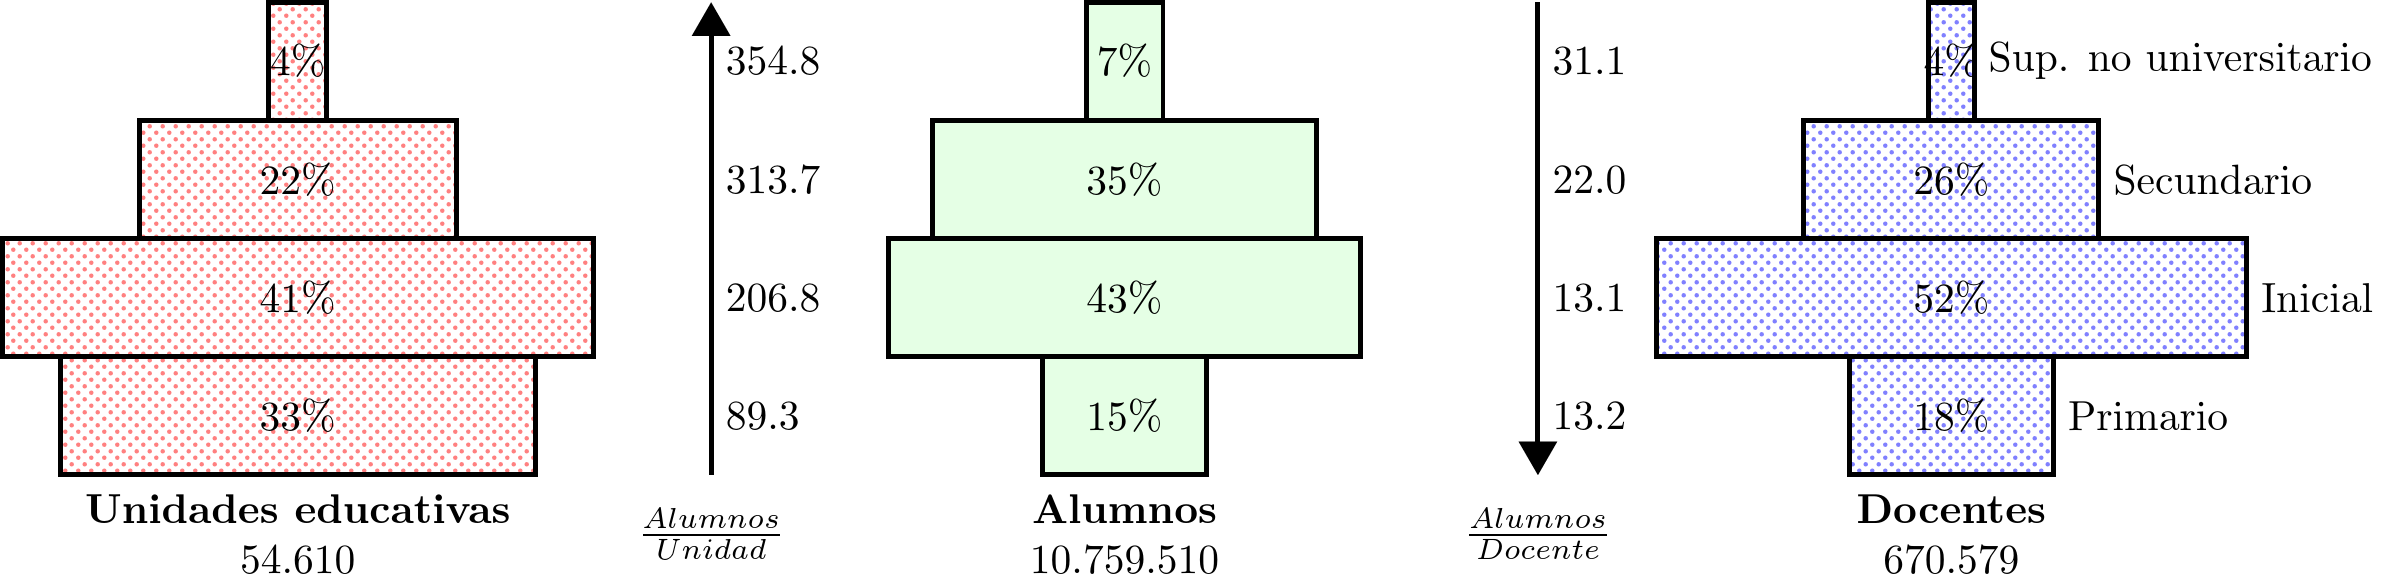
Plot Vertical bars plot 2
The build-in plot draws a vertical bars plot.
Drawing created with the following tikzpy code:
  1# python3
  2
  3### Load tikzpy library
  4import os, sys
  5import tikzpy as py_tikZ
  6import numpy as np
  7
  8### Load main object
  9tikZ = py_tikZ.load()
 10tikZ.dpi=300
 11
 12### Add point at x=0, y=0, z=0
 13p0 = tikZ.pto.pto(0,0,0)
 14
 15### Assembly type bar plots 1
 16vbar = tikZ.plots.bars_vertical(group = 0)
 17
 18N = 4
 19data_buff = tikZ.dbuffer.load_empty_dbuff(N)
 20vbar.lbl_axis0 = "axis0"
 21data_buff[vbar.lbl_axis0] = np.asarray([15,	43,	35,	7])
 22vbar.lbl_label1 = "axis1"
 23data_buff[vbar.lbl_label1] = np.asarray(["15\\%", "43\\%", "35\\%", "7\\%"])
 24vbar.lbl_label2 = "axis2"
 25data_buff[vbar.lbl_label2] = np.asarray(["","","",""])
 26vbar.title = r"\textbf{Alumnos} \\ 10.759.510"
 27vbar.load_data_buffer(data_buff)
 28
 29vbar.width = 4
 30vbar.p0 = p0
 31vbar.draw_plot()
 32# Changeline type & fill
 33tikZ.shp.fill_to_shapes(vbar.lst_path0, "green!10")
 34tikZ.shp.thick_to_shapes(vbar.shps, "very thick")
 35
 36### Assembly type bar plots 2
 37vbar = tikZ.plots.bars_vertical(group = 0)
 38
 39N = 4
 40data_buff = tikZ.dbuffer.load_empty_dbuff(N)
 41vbar.lbl_axis0 = "axis0"
 42data_buff[vbar.lbl_axis0] = np.asarray([18,	52,	26,	4])
 43vbar.lbl_label1 = "axis1"
 44data_buff[vbar.lbl_label1] = np.asarray(["18\\%", "52\\%", "26\\%", "4\\%"])
 45vbar.lbl_label2 = "axis2"
 46data_buff[vbar.lbl_label2] = np.asarray(["Primario","Inicial","Secundario","Sup. no universitario"])
 47vbar.title = r"\textbf{Docentes} \\ 670.579"
 48vbar.load_data_buffer(data_buff)
 49
 50vbar.width = 5
 51vbar.p0 = p0
 52mpto = p0.copy()
 53mpto.x = mpto.x + 6 + 1
 54vbar.move(mpto)
 55vbar.draw_plot()
 56# Changeline type & fill
 57pattern1 = tikZ.shp.pattern_build("crosshatch dots", color = "blue!50")
 58tikZ.shp.fill_to_shapes(vbar.lst_path0, pattern1)
 59tikZ.shp.thick_to_shapes(vbar.shps, "very thick")
 60
 61### Assembly type bar plots 3
 62vbar = tikZ.plots.bars_vertical(group = 0)
 63
 64N = 4
 65data_buff = tikZ.dbuffer.load_empty_dbuff(N)
 66vbar.lbl_axis0 = "axis0"
 67data_buff[vbar.lbl_axis0] = np.asarray([33,	41,	22,	4])
 68vbar.lbl_label1 = "axis1"
 69data_buff[vbar.lbl_label1] = np.asarray(["33\\%", "41\\%", "22\\%", "4\\%"])
 70vbar.lbl_label2 = "axis2"
 71data_buff[vbar.lbl_label2] = np.asarray(["","","",""])
 72vbar.title = r"\textbf{Unidades educativas} \\ 54.610"
 73vbar.load_data_buffer(data_buff)
 74
 75vbar.width = 5
 76vbar.p0 = p0
 77mpto = p0.copy()
 78mpto.x = mpto.x - 6 - 1
 79vbar.move(mpto)
 80vbar.draw_plot()
 81# Changeline type & fill
 82pattern1 = tikZ.shp.pattern_build("crosshatch dots", color = "red!50")
 83tikZ.shp.fill_to_shapes(vbar.lst_path0, pattern1)
 84tikZ.shp.thick_to_shapes(vbar.shps, "very thick")
 85
 86### Assembly type arrow plot
 87vbar = tikZ.plots.arrow_vertical(group = 0)
 88
 89N = 4
 90data_buff = tikZ.dbuffer.load_empty_dbuff(N)
 91vbar.lbl_axis0 = "axis0"
 92data_buff[vbar.lbl_axis0] = np.asarray([13.2,13.1,22.0,31.1])
 93vbar.lbl_label1 = "axis1"
 94data_buff[vbar.lbl_label1] = np.asarray(["13.2", "13.1", "22.0", "31.1"])
 95vbar.title = r"\textbf{$\frac{Alumnos}{Docente}$}"
 96vbar.load_data_buffer(data_buff)
 97
 98vbar.width = 4
 99vbar.p0 = p0
100vbar.up_down = True
101vbar.thick_scale = 0
102mpto = p0.copy()
103mpto.x = mpto.x + 3.5
104vbar.move(mpto)
105vbar.draw_plot()
106tikZ.shp.thick_to_shapes(vbar.shps, "very thick")
107
108### Assembly type arrow plot
109vbar = tikZ.plots.arrow_vertical(group = 0)
110
111N = 4
112data_buff = tikZ.dbuffer.load_empty_dbuff(N)
113vbar.lbl_axis0 = "axis0"
114data_buff[vbar.lbl_axis0] = np.asarray([89.3,206.8,313.7,354.8])
115vbar.lbl_label1 = "axis1"
116data_buff[vbar.lbl_label1] = np.asarray(["89.3","206.8","313.7","354.8"])
117vbar.title = r"\textbf{$\frac{Alumnos}{Unidad}$}"
118vbar.load_data_buffer(data_buff)
119
120vbar.width = 4
121vbar.p0 = p0
122vbar.up_down = False
123vbar.thick_scale = 0
124mpto = p0.copy()
125mpto.x = mpto.x - 3.5
126vbar.move(mpto)
127vbar.draw_plot()
128tikZ.shp.thick_to_shapes(vbar.shps, "very thick")
129
130### Make drawing
131path = os.path.dirname(os.path.abspath(__file__))
132name = os.path.basename(os.path.abspath(__file__))
133name = os.path.splitext(name)[0]
134tikZ.save_pdf(path, name)
Plot Vertical arrow plot 1
The build-in plot draws a vertical arrow plot.
Drawing created with the following tikzpy code:
 1# python3
 2
 3### Load tikzpy library
 4import os, sys
 5import tikzpy as py_tikZ
 6import numpy as np
 7
 8### Load main object
 9tikZ = py_tikZ.load()
10tikZ.dpi=300
11
12### Add point at x=0, y=0, z=0
13p0 = tikZ.pto.pto(0,0,0)
14
15### Assembly type arrow plot
16vbar = tikZ.plots.arrow_vertical(group = 0)
17
18N = 4
19data_buff = tikZ.dbuffer.load_empty_dbuff(N)
20vbar.lbl_axis0 = "axis0"
21data_buff[vbar.lbl_axis0] = np.asarray([15,	43,	35,	7])
22vbar.lbl_label1 = "axis1"
23data_buff[vbar.lbl_label1] = np.asarray(["13.2", "13.1", "22.0", "31.1"])
24vbar.title = r"\textbf{$\frac{Alumnos}{Docente}$}"
25vbar.load_data_buffer(data_buff)
26
27vbar.width = 4
28vbar.p0 = p0
29vbar.up_down = False
30vbar.thick_scale = 0
31
32vbar.draw_plot()
33# Changeline type & fill
34tikZ.shp.fill_to_shapes(vbar.lst_path0, "red!10")
35
36### Make drawing
37path = os.path.dirname(os.path.abspath(__file__))
38name = os.path.basename(os.path.abspath(__file__))
39name = os.path.splitext(name)[0]
40tikZ.save_pdf(path, name)